

RECORDED MUSIC INDUSTRY OVERVIEW
Barbados

Latin America and the Caribbean
Potential of Recorded Music
We estimate the potential of recorded music value available to songwriters, music performers, publishers, and producers in Barbados. These are annual revenue levels achievable within a well-functioning market supported by critical infrastructure, including robust policies, adequate legal frameworks, and effective collective management organizations and other enforcement mechanisms. By identifying these factors as the necessary drivers of growth, we quantify the opportunity cost of their absence.
The potential value calculations are based on CISAC, ICMP, and IFPI data. We used an econometric model and a cluster analysis approach to benchmark Barbados against peer markets and reflect achievable collection levels given their unique socio-economic contexts. We also factored in a series of foundational assumptions and collective rights management expertise to provide a stable and realistic valuation.
1) Copyright: digital, performance rights (radio & TV broadcasting, rebroadcasting & retransmission, background music and private copying levies), CD & video, synchronisation and other;
2) Neighbouring rights: Streaming, performance rights (radio & TV broadcasting, cablecasting, cable retransmission, public performance, dubbing, private copying levies, and internet (webcasting, simulcasting, catch-up) licensing), downloads & digital, physical and synchronisation.
Coming soon

Socioeconomic Indicators
EXPLANATORY NOTES: Data via World Bank, using statistical databases and publications from national statistical offices, and UN and ESTAT publications. Accessed 15/01/2026.
282,467
EXPLANATORY NOTES: Data via World Bank Development Indicators database. Accessed 15/01/2026.
$6,168
EXPLANATORY NOTES: Data via World Bank, using national accounts data, and OECD National Accounts data files. Accessed 15/01/2026.
$26,544.87
2.48%
EXPLANATORY NOTES: Data via World Bank, using national accounts data, and OECD National Accounts data files. Accessed 15/01/2026.
EXPLANATORY NOTES: Data via World Income Inequality Database (WIID), United Nations University World Institute for Development Economics Research. Accessed 20/04/2026.
56.5%
EXPLANATORY NOTES: Data via IMF World Economic Outlook. Accessed 16/01/2026.
2.50%
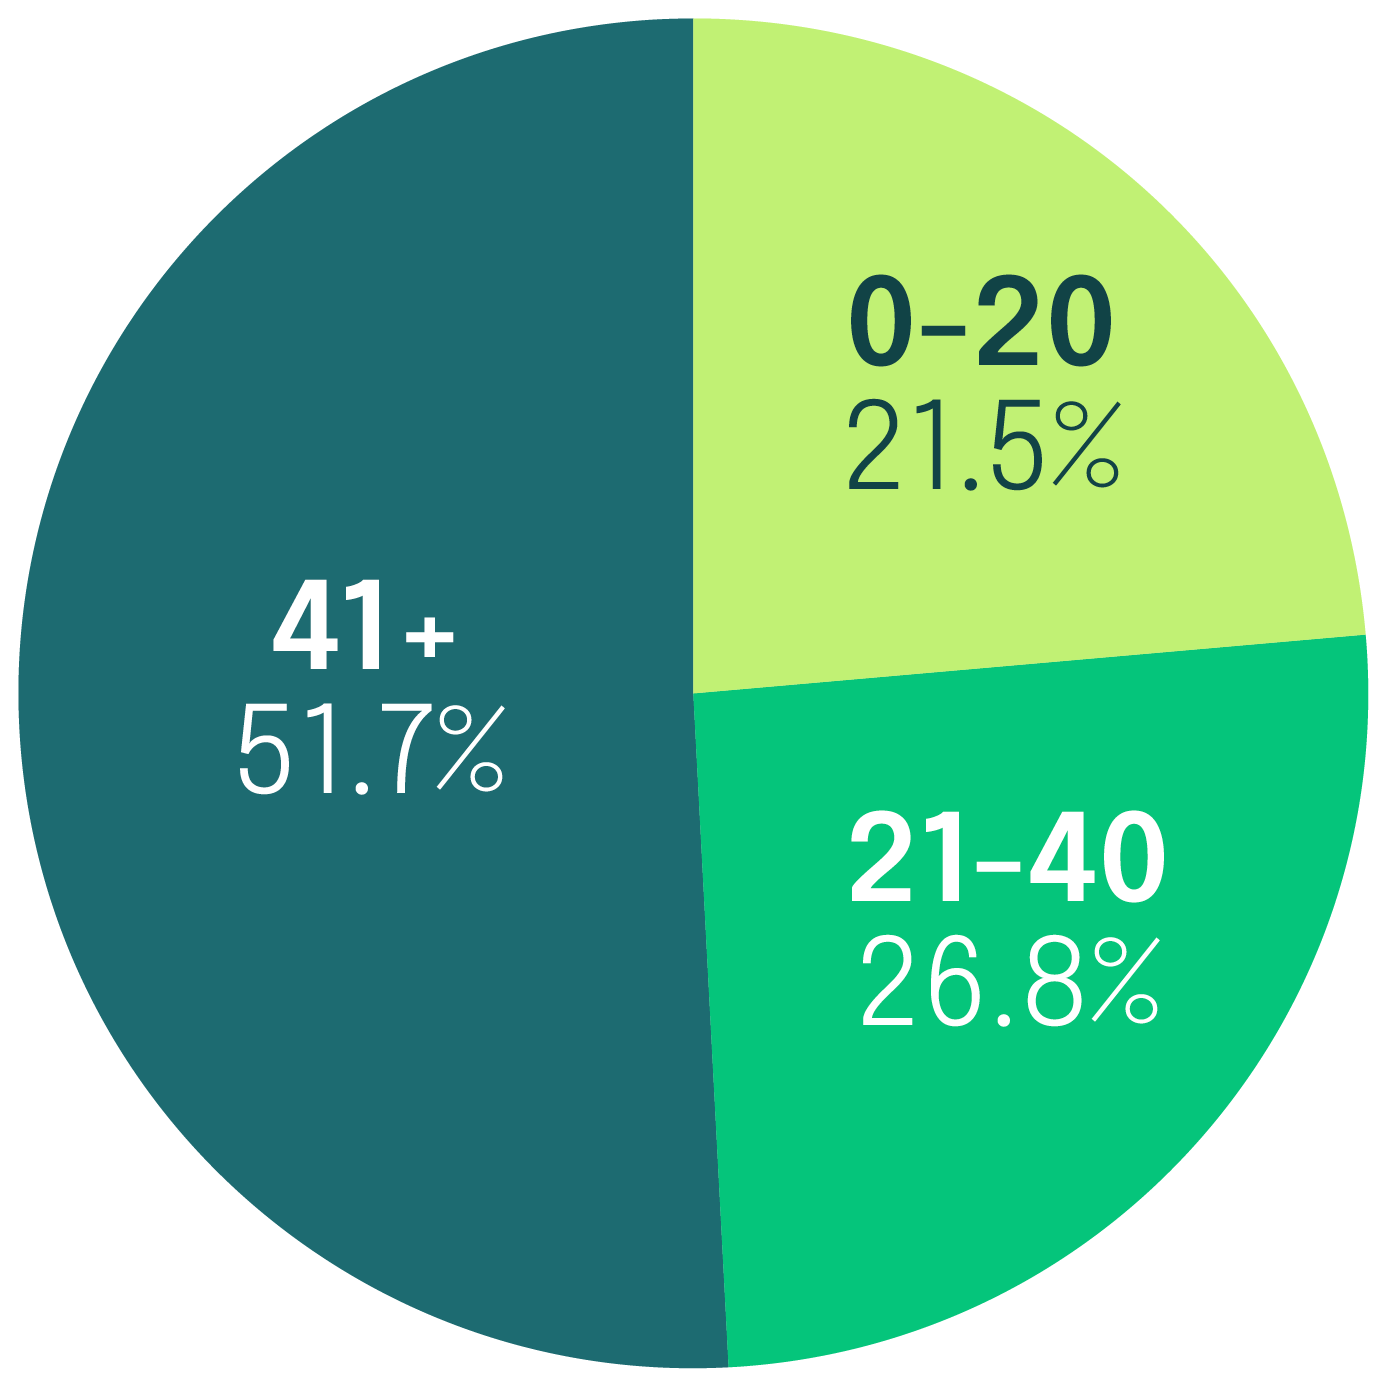
EXPLANATORY NOTES: Data via US Census Bureau International Database (IDB). Accessed 16/01/2026.
EXPLANATORY NOTES: Data via World Bank, using United Nations Population Division database. Accessed 16/01/2026.
59.54%
EXPLANATORY NOTES: Data via CIA World Factbook. Accessed 16/01/2026.
7.60%
EXPLANATORY NOTES: Data via CIA World Factbook. Accessed 16/01/2026.
23.70%
EXPLANATORY NOTES: Poverty rate at $3.00 a day (2021 PPP) (% population).Data via Poverty and Inequality Platform, The World Bank. Accessed 15/01/2026.
1.68%
EXPLANATORY NOTES: Data via International Telecommunication Union (ITU) DataHub. Accessed 15/01/2026.
80.0%
N/A
N/A
EXPLANATORY NOTES: Data via Cable.co.uk. Accessed 20/04/2026.
$2.75

Industry Infrastructure
Collective Management Organisations
Authors & Publishers
Performers
Producers
Voluntary Joint Ventures & Umbrella entities for licensing users
None
Associations
Music Authors
None
Music Publishers
None
Music Performers
Sound Recording Producers/Labels
None
Other
Music Export Office
None
Joint Industry Body
None
Policies
Culture Policy/Strategy
Music Policy/Strategy
None
Legal Framework
Digital and Performance Rights Treaties
Other Treaties
National Copyright Legislation
National Treatment
-
Barbados protects the works first published in Barbados or a specified country. It also protects the rights of authors who are citizens or have a habitual residence in the country party to treaties that Barbados is a party and in accordance with the decree of the Minister, based on reciprocity.
Qualifying foreign authors enjoy copyright protection concerning reproduction and performance rights. Copyright law does not provide the making available rights. -
Barbados protects the rights of performers and producers of phonograms who are citizens, have a habitual residence or, in case of an entity, body incorporated or established under any enactment in force in the country party to treaties that Barbados is a party and in accordance with the decree of the Minister, based on reciprocity.
Barbados also protects performances that take place in Barbados.
Sound recordings are protected as works therefore the same eligibility criteria as for works apply to sound recordings (phonograms).
Qualifying foreign performers and producers of phonograms enjoy protection concerning reproduction rights and performance rights. Copyright law does not provide making available rights. -
“National Treatment” refers to the assimilation of the treatment of foreign right holders to that of domestic right holders. It is a basic rule of most international conventions and mandates that foreign rights holders from contracting countries must receive the protection within any other contracting country as that country grants to its own nationals, ensuring equal rights under the scope of the relevant convention.
General national treatment obligations are set out in Article 5 of the Berne Convention and Article 2 of the Rome Convention, providing that the members of respective conventions must grant to each other’s nationals the rights provided in the convention. Berne Convention also extends the national treatment to “the rights which their respective laws do now or may hereafter grant to their nationals,” while Rome Convention members are not obliged to extend national treatment to the rights of performers and producers of phonograms which are accorded under their national law over and above the rights enshrined in the Rome Convention.
The criteria for eligibility for protection are provided in Article 3 of the Berne Convention and Articles 4 and 5 of the Rome Convention. With regards to national treatment of producers of phonograms, members of the Rome Convention may reserve the right not to apply either the criterion of fixation or that of publication of the phonogram.
As per WIPO, the total number of members to the key treaties above is as follows:
Berne Convention: 181 Members
Rome Convention: 98 Members
WIPO Copyright Treaty: 118 Members
WIPO Performances and Phonograms Treaty: 114 Members
TRIPS Agreement: 166 MembersThis is a high-level overview concerning national treatment of music authors, performers and producers of phonograms; for comprehensive and detailed provisions, refer to the laws of each country. The overview:
1) details only the criteria applicable to foreign rights holders, without including the broader set of qualification rules for domestic protection that do not concern them,
2) is limited to performance rights and digital exploitation of recorded music, including works and other protected objects:
- “Performance rights” include radio and TV broadcasting, public performance, and communication to the public,
- “Digital exploitation” includes reproduction rights, distribution rights, communication to the public and making available rights.
The term "based on reciprocity" used in the overview for some countries means that Country A will protect the works of authors or other right holders who are nationals of Country B that is not a member of treaties Country A is a party to, and whose works or other protected objects were first published outside of Country A, only if Country B offer similar copyright protection to Country A’s authors or other rights holders and works and other protected objects respectively first published in Country A.
The term "treaty" in the overview includes conventions and international agreements.
Music Consumption
Domestic Repertoire Quotas
Yes
There is a domestic repertoire quota for broadcasters requiring that "at least 60 per cent of broadcasting material is local and regional in content and character".
The full text of the quota may be found in Section 10 of the Broadcasting Regulations (2000).
Digital Streaming Services








GLOBAL STREAMING SERVICES
REGIONAL STREAMING SERVICES

DOMESTIC STREAMING SERVICES

Key Risks and Opportunities
Risks
The small populationsize, coupled with limited disposable income—driven by moderate GDP per capita and high youth unemployment—makes relying solely on the domestic market a risk for scalability and profitability.
High mobile data costs might be a barrier to users frequently accessing online streaming services, impacting consumption.
Despite the otherwise solid legal framework for copyright, the absence of 'making available' rights for rights holders weakens digital rights enforcement and creates challenges for monetizing content in the online environment.
Opportunities
Annual GDP growth signals economic expansion, with potentially increasing disposable income for entertainment in the future.
The inclusion of music as a primary sector under the Cultural Industries Development Act signals a recognition of its economic and cultural value, and opens doors for potential government support, tax breaks, and investment incentives—making it more attractive for businesses.
The presence of major global streaming services offers Barbadian artists a pathway to reach international audiences and tap into global revenue streams.